
MinerAlert
MinerAlert
Active-mixing Hotend in Fused Filament Fabrication Learning
Advance functional gradient additive manufacturing technologies.
Technical approach
Develop an FFF printer with an active-mixing hotend supported by firmware and software to enable LCC with well-mixed blends of thermoplastic filaments.
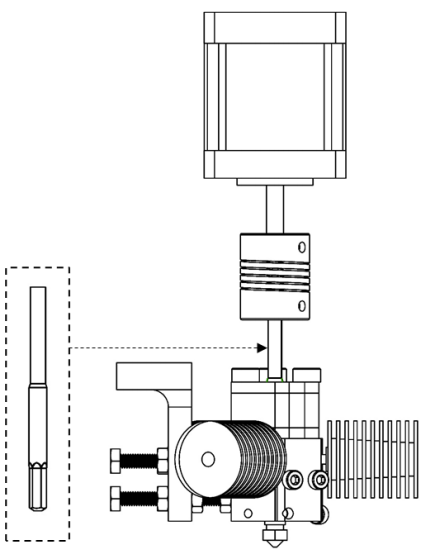
Figure 1 – Diagram of patent-pending active-mixing hotend. Actuated element facilitates the blending of three filaments before extruding through the nozzle.
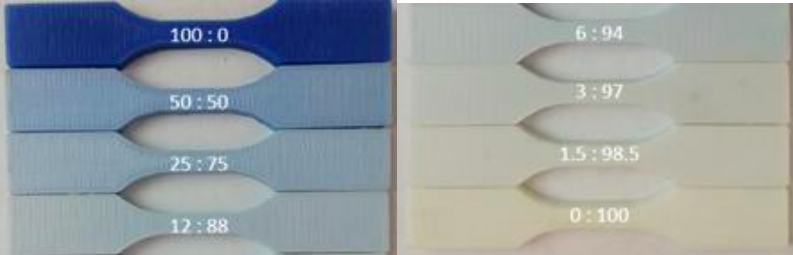
Figure 2 – Images of tensile test specimens composed of blue high-temperature polylactic acid (HTPLA) and white Ninjaflex thermoplastic elastomer (NF).
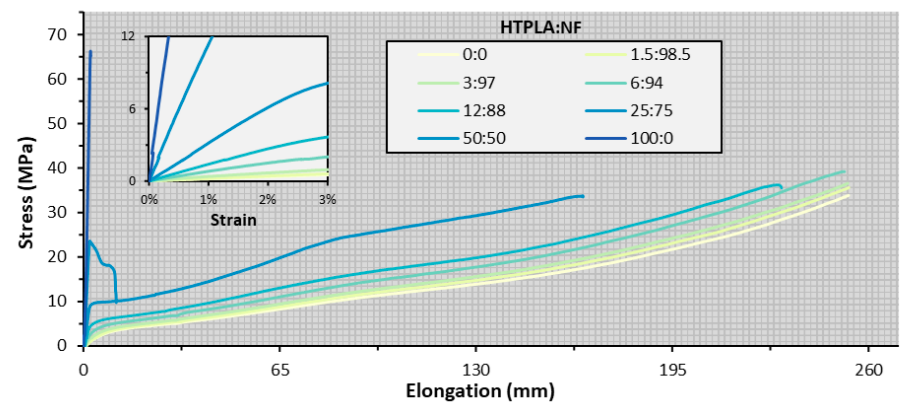
Figure 3 – Representative stress-displacement curves for blends of HTPLA and NF. The inset graph provides a detailed view of stress-strain curves for strain values below 3% as recorded by an extensometer.
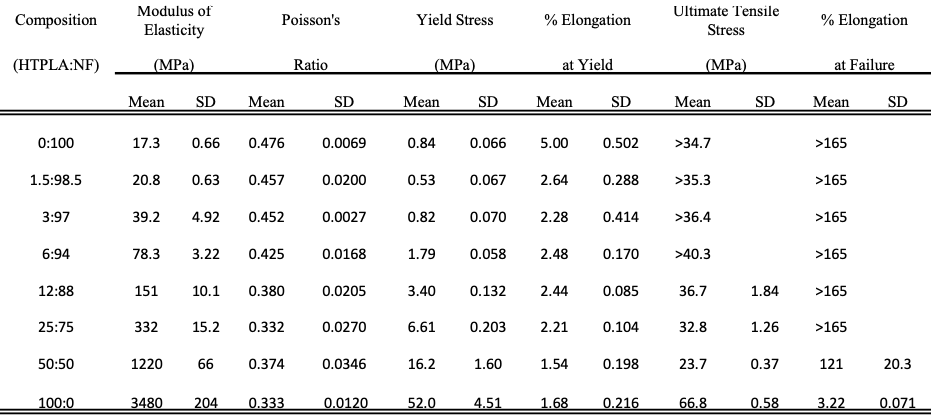
Figure 4 – Summary of tensile test results.
Synthetic ACL development using LCC
Investigate synthetic tissue fabrication using local composition control (LCC) in fused filament fabrication (FFF) to promote effective surgical training in surgical simulation.
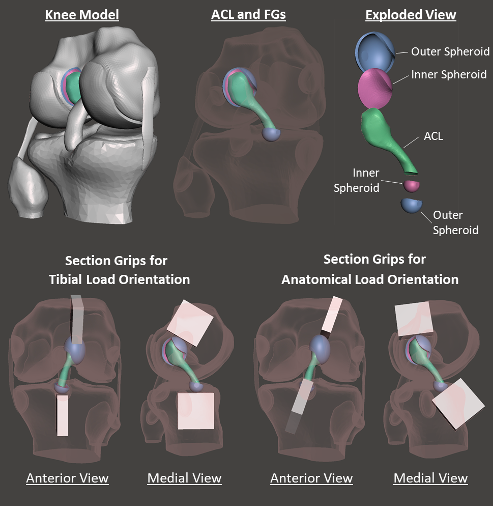
Figure 1 – Computer models of knee components and grip sections to facilitate mounting in tensile test equipment.
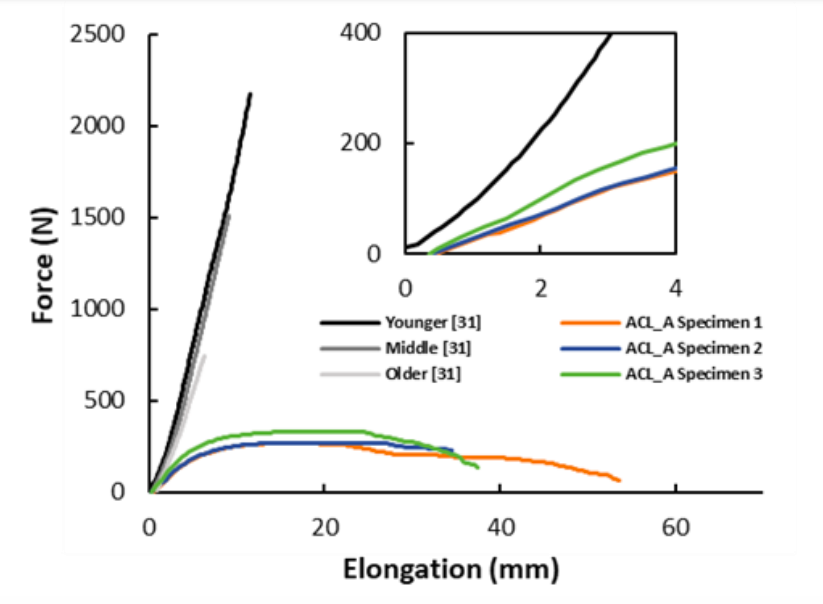
Figure 2 – Load-elongation curves of FATCs from tensile tests in anatomical load orientations. The graph includes results from three synthetic FATCs and a load-elongation curve for younger cadaveric FATCs are included for reference, which was reported by Woo et al.
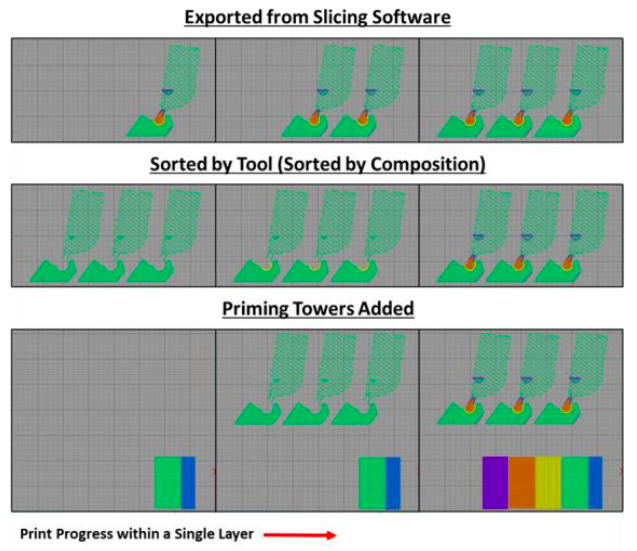
Figure 3 – Single layer preview of FATC print files including LCC and FGs in various stages of processing.
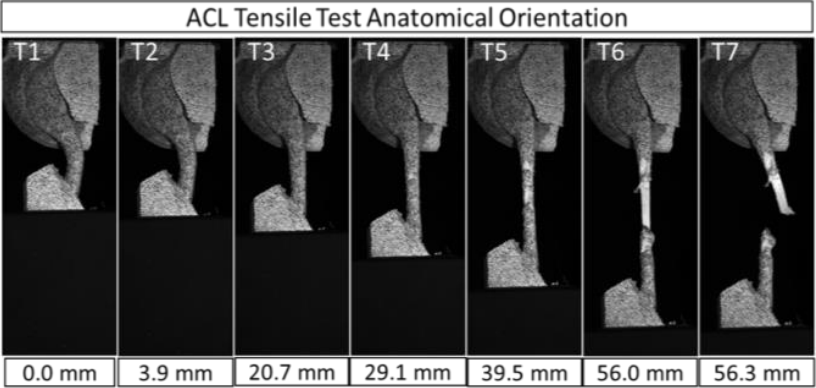
Figure 4 – Representative images of a synthetic FATC specimen during tensile testing. Images were collected by DIC image capture and correspond with notable phases of load response.
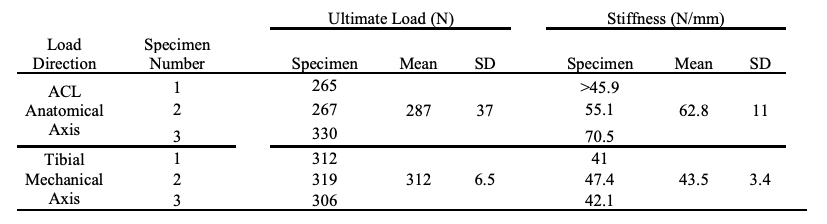
Table 1 – Summary of tensile test results from loading synthetic FATC specimens along anatomical and tibial orientations with 30° knee flexion.
Joint Load Simulator
Technical approach
Develop an in vitro simulator with two robotic manipulators and eight musculotendon actuators:
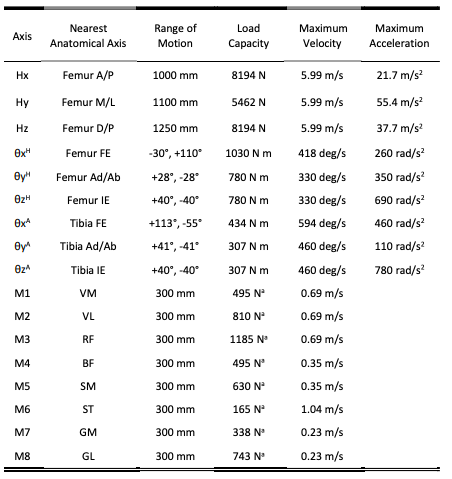
Table 1 –Simulator design characteristics.
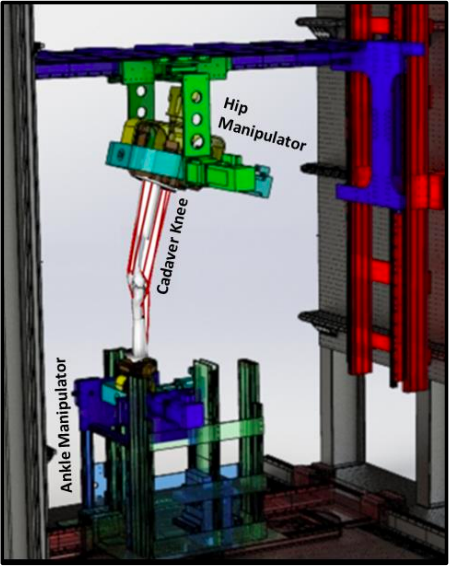
Figure 1 – rendering of the UTJLS. (The color indicates axes of control. The upper manipulator includes three translations (red, blue, green). Both manipulators have three rotations (yellow, teal, brown). The lower manipulator has manufactured components corresponding with a design for translations (transparent).)
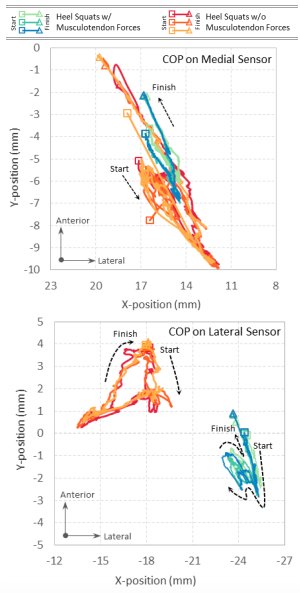
Figure 2 – Center of pressure (COP) on medial and lateral tibial plateaus for two squat maneuvers which were repeated three times on the same cadaver. Warm colors are COP paths without muscle forces, and cool colors are COP paths with 50% scaled muscle forces. These pressure measurements are highly sensitive to variations in load and indicate the highly repeatable performance of the UTJLS.
Prosthetic Knee Stumble Detection using Machine Learning
Provide real-time identification of stumbles to support microprocessor operation to reduce the incidence of amputee injury from stumbling.
Technical approach
LIMBS M3 prosthetic knee was modified to include two nine degrees of freedom (DOF) inertial measurement units (IMU) with Google Coral microprocessor. The system was configured to record kinematic data during prosthesis use. Three amputees were fitted with the custom prosthetic knee, and kinematic data were collected during gait sessions including induced stumbling. A variety of stumbling was induced including stumbling due to load from a bungee, impact with an obstacle, and stumbling as a result of an uneven surface. A recurrent machine learning network was developed to accurately predict stumbling using long short-term memory (LSTM). Leave-one-out cross-validation was used due to the small dataset of three subjects.
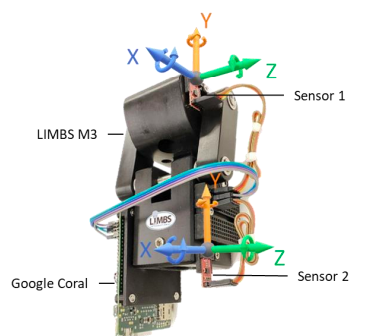
Figure 1 – LIMBS M3 prosthetic knee modified to include nine degrees of freedom inertial measurement units on both the femoral and tibial components of the prosthetic knee. Google Coral microprocessor captures data from sensors to develop kinematic datasets and for the development of machine learning networks.
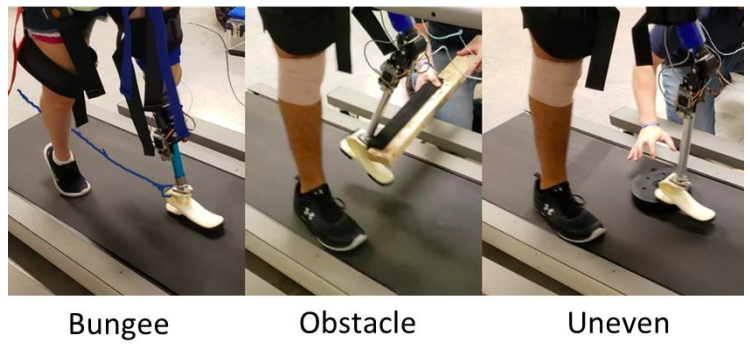
Figure 2 – Images of the three methods used to induce stumbling during gait.
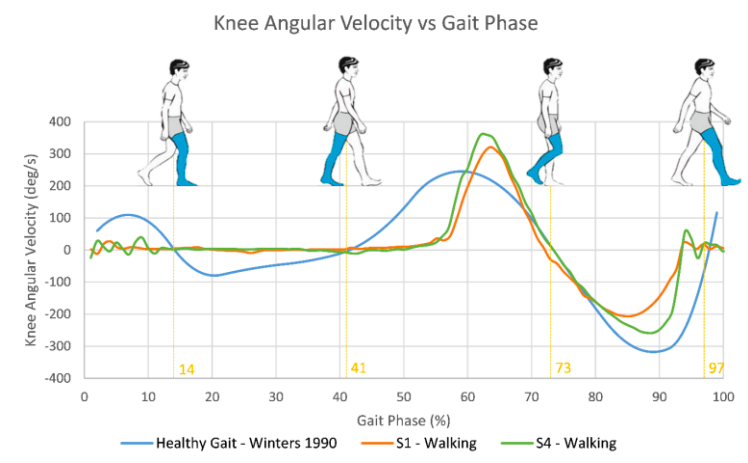
Figure 3 – Angular velocity of knee flexion with respect to gait phase. Representative gait profiles from two above-knee amputees are plotted alongside a gait profile from a healthy subject as reported by Winters [Winters 1990].
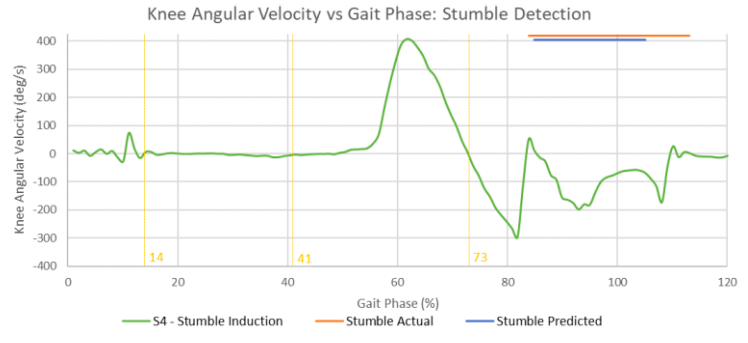
Figure 4 – Example of the angular velocity of the prosthetic knee during stumbling. Redline indicates stumble as identified by lab personnel, and the blue line indicates stumble as identified by recurrent machine learning network.
Additional Research Topics